
Do you ever wonder what a computer thinks of your web site? How does it perceive the relationship between tags? Probably not the sort of thing you do every day.
I found a Java Applet online that creates coloured graphs from the html of web pages. Not quite what computers see. More an artists interpretation. Interesting to see what how the structure of your site is interlinked.
A collection of graphs I have created (click for a larger image):
 The RPG Gateway main page
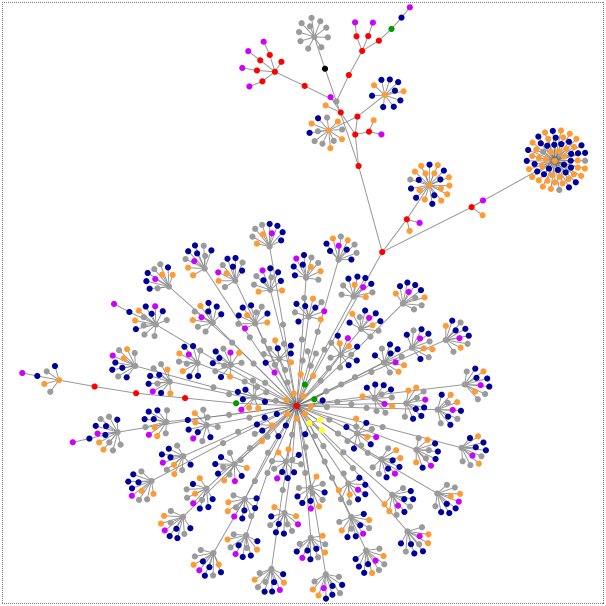 One of the larger categories I manage on RPG Gateway, People and Places : Conventions : US and Canada
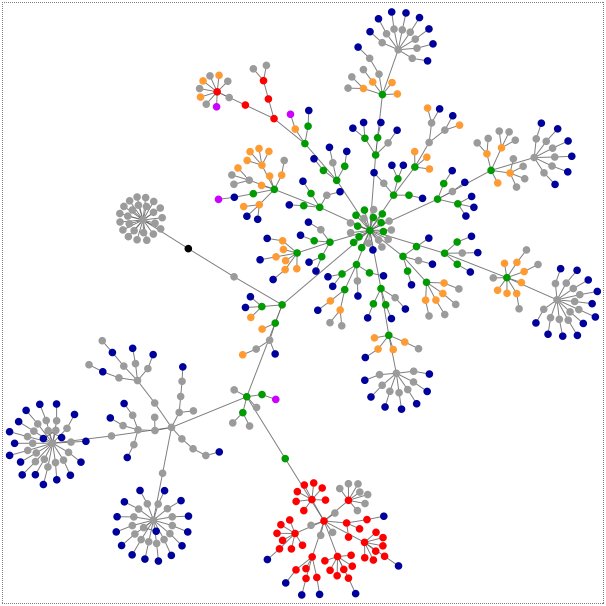 This blog
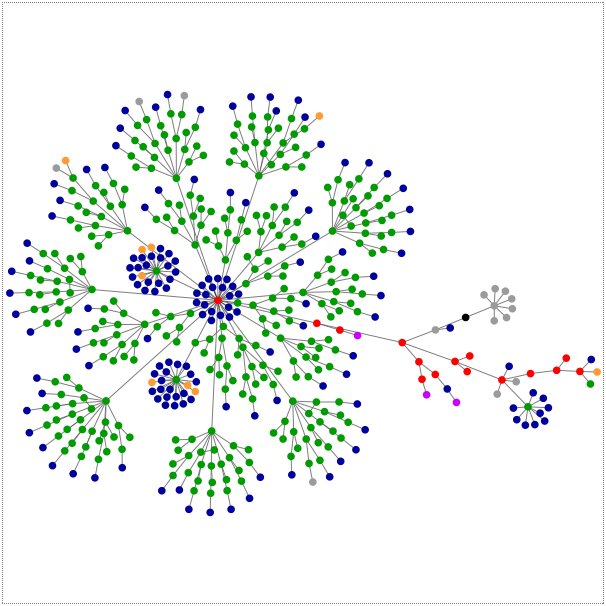 The Links page on the TenguTech site
You can find the Java Applet online here at Websites as graphs – an HTML DOM Visualizer Applet
(Link to www.aharef.info/static/htmlgraph removed as Google lists the site as containing malware)